Reporting Surface Profile Output with Max and Min deviation only
From ArcoWiki
When reporting a GSURF or a GCURVE taken with large number of data (example, with continuous scanning or laser scanner), the output document of a feature profile can be very long and almost meaningless since so many numbers are not interesting to understand the real deviation of the feature.
The most significant number are the MAX and MIN value of the deviation which represents the two peaks of the profile deviation.
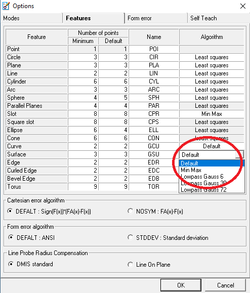
In order to enable the output of the MIN/MAX deviation of either a GCURVE or GSURF, it is necessary to go in the Option dialog, open the Features tab and select, in the Feature Algorithm the Min/Max option.
.
